I moved to Seattle three months ago and found there were many Asian food restaurants here. Some of the Chinese food is really authetic. However, when I was enjoying the food in some Chinese restaurants I found many customers are Asian people, which indicates Americans don't like Chinese food very much. To analysis how popular Chinese food is in Seattle, I scraped the information of restuarants in Seattle for different styles of Asian food from Yelp.
1. Scraping Data From Yelp
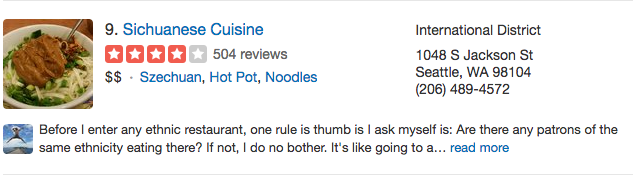
I scraped four types of food: chinese, japanese, thai, vietnamese. As the image shows below, the scraped information of a restaurant includes Name, Price(dollor sign), Review_count, Star(rating from 0 to 5 stars), Category(the type of food) and Address. Yelp lists ten restaurants each page, so you need specify the number of restaurants you want to scrape (set the parameter num_restaurant in the code).
I wrote Python code to scrape data from Yelp. You can either choose store the data into MySQL database or csv file. The code can also be found at my github.
1 2 3 4 5 6 7 8 9 10 11 12 13 14 15 16 17 18 19 20 21 22 23 24 25 26 27 28 29 30 31 32 33 34 35 36 37 38 39 40 41 42 43 44 45 46 47 48 49 50 51 52 53 54 55 56 57 58 59 60 61 62 63 64 65 66 67 68 69 70 71 72 73 74 75 76 77 78 79 80 81 82 83 84 85 86 87 88 89 90 91 92 93 94 95 96 97 98 99 100 101 102 103 104 105 106 107 108 109 110 111 112 113 114 115 116 117 118 119 120 121 122 123 124 125 126 127 128 129 130 131 132 133 134 135 136 137 138 139 140 141 142 143 144 145 146 147 148 149 150 151 152 153 154 155 156 157 158 159 160 161 162 163 164 165 | #!/usr/bin/env python3
# -*- coding: utf-8 -*-
"""
Created on Thu Dec 15 15:38:11 2016
@author: Vincent
"""
import requests
from bs4 import BeautifulSoup
import re
import pymysql
import csv
import os
class YelpSeattleRestaurant:
"""
The code scrapes the restaurant information of Name, Price, Category, Star and
Review count in Seattle areas. You can use it to scrape other areas but the url
need be modified correctly.
Params: url: the web page link of restaurant list.
num_restaurant: the number of restaurant. Since Yelp has 10 restaurants
per page, the code scrapes the largest multiple of 10 less than num_restaurant
Note: MySQL database need be created before executing.
"""
def __init__(self, url, num_restaurant, style):
self.UA = 'Chrome/54 (Macintosh; Intel Mac OS X 10.11; rv:32.0) Gecko/20100101 Firefox/32.0'
self.url = url
self.page_num = [str(i) for i in range(0, num_restaurant, 10)]
self.style = style
def scrape_name(self, soup):
# seach a outer tag and a inner tag
name = ''
name_div = soup.find_all('h3', {'class': 'search-result-title'})
name_a = soup.find_all('a', {'class': 'biz-name js-analytics-click'})
for d in name_a:
name = name + d.string
return name
def scrape_price(self, soup):
price = ''
price_ = soup.find_all('span', {'class': 'business-attribute price-range'})
for p in price_:
price = price + p.string
return price
def scrape_category(self, soup):
category = ''
category_ = soup.find_all('span', {'class': 'category-str-list'})
if category_:
for c in category_:
## .get_text() returns the same as .text; ## replace both '\n' and space with ''
category = category + c.get_text().strip().replace('\n', '').replace(' ', '')
else:
category = None
return category
def scrape_star(self, soup):
star = ''
star_ = soup.find_all('div', {'class': re.compile('i-stars i-stars*')})
if star_:
for s in star_:
star_str = s['title'].split()[0]
star = star + star_str
else:
star = None
return star
def scrape_review(self, soup):
review_count = ''
reviews = soup.find_all('span', {'class': 'review-count rating-qualifier'})
if reviews:
for r in reviews:
review_count = review_count + r.text.strip().split()[0]
else:
review_count = None
return review_count
def scrape_address(self, soup):
address = ''
address_ = soup.find_all('address')
if address_:
for a in address_:
address = address + a.text.strip()
else:
address = None
return address
def store(self, name, price, review_count, star, category, address):
conn = pymysql.connect(host='localhost',
user='root',
passwd='root',
db='Yelp_scrape',
use_unicode=True,
charset="utf8")
# create a cursor object in order to execute queries
cur = conn.cursor()
# create a new record
sql = 'Insert into Restaurant (Name, Price, Review_count, ' \
'Star, Category, Address) Values (%s, %s, %s, %s, %s, %s)'
cur.execute(sql, (name, price, review_count, star, category, address))
# commit changes
cur.connection.commit()
def write_mysql(self):
for i, page in enumerate(self.page_num):
print('Begin to scrape: Page %s' % (i))
url_curr = self.url + page + '&cflt=' + self.style
html = requests.get(url_curr, headers={'User-Agent': self.UA})
soup = BeautifulSoup(html.content, 'lxml')
restaurants_div = soup.find_all('div', {'class': 'biz-listing-large'})
for restaurant in restaurants_div:
name = self.scrape_name(restaurant)
price = self.scrape_price(restaurant)
category = self.scrape_category(restaurant)
star = self.scrape_star(restaurant)
review_count = self.scrape_review(restaurant)
address = self.scrape_address(restaurant)
# for each restaurant, store its information in MySQL database
try:
self.store(name, price, review_count, star, category, address)
except:
# print('Failed or error')
pass
print('Finished scraping: Page %s' % (i))
def write_csv(self):
# if the file doesn't exist, create a new file
file = 'yelp_' + self.style + '.csv'
if not os.path.exists(file):
with open(file, 'w') as f:
writer = csv.writer(f)
writer.writerow(['Name', 'Price', 'Review_count', 'Star', 'Category', 'Address'])
else:
pass
# check each restaurant, append its info into csv file.
for i, page in enumerate(self.page_num):
print('Begin to scrape: Page %s' % (i))
url_curr = self.url + page + '&cflt=' + self.style
html = requests.get(url_curr, headers={'User-Agent': self.UA})
soup = BeautifulSoup(html.content, 'lxml')
restaurants_div = soup.find_all('div', {'class': 'biz-listing-large'})
for restaurant in restaurants_div:
name = self.scrape_name(restaurant)
price = self.scrape_price(restaurant)
category = self.scrape_category(restaurant)
star = self.scrape_star(restaurant)
review_count = self.scrape_review(restaurant)
address = self.scrape_address(restaurant)
with open(file, 'a') as f: # note the mode is 'a', append
writer = csv.writer(f)
writer.writerow([name, price, review_count, star, category, address])
print('Finished scraping: Page %s' % (i))
url = 'https://www.yelp.com/search?find_desc=restaurants&find_loc=Seattle,+WA&start='
num_restaurant = 300
styles = ['chinese', 'japanese', 'thai', 'vietnamese', 'india',
'American (New)', 'American (Traditional)']
Scraper = YelpSeattleRestaurant(url, num_restaurant, 'vietnamese')
Scraper.write_csv()
|
2. Visualization in R
We have scraped the information of restaurants using Python and stored them into seperate .csv files, now we simply use R(ggplot2) to visualize the relation between different variables.
- Read and combine data from seperate files. Create a new column to indicate the style(country) of the restaurant. Note actually one restaurant may have more than one style, and even some of them have overlapping, for example one restaurant may be labeled as
chineseandthaiat the same time, we just keep these overlappings and allow one restaurant appears in multiple categories.
styles <- c('chinese', 'japanese', 'thai', 'vietnamese')
read_data <- function(styles){
  data <- data.frame()
  for(s in styles){
    file = paste0('yelp_', s, '.csv', sep='')
    temp = read.csv(file, header = TRUE)
    temp$Style <- s
    data <- rbind(data, temp)
  }
  data$Style <- factor(data$Style)
  data <- data[!is.na(data$Star), ]
  return(data)
}
data <- read_data(styles)
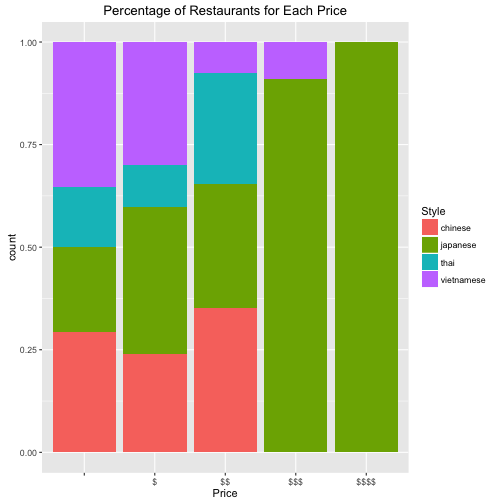
Question 1: For Asian foods, which one is expensive or cheap?
For the low-end restaurant market, Vietnamese style has higher market share than its overall ratio. Chinese food performs neither better nor worse. Chinese restaurants has a large amount but most of them are less than 2 dollar signs. What surprised me is that the high-end market is totally dominated by Japanese food. Except one Vieranamese food restaurant, all the ones greater than 3 dollar signs are Japanese.
library(ggplot2)
library(dplyr)

data %>%
  group_by_('Style') %>%
  summarize(Num_restaurant = n(), Ratio_restaurant = n()/nrow(data))
## # A tibble: 4 <U+00D7> 3
##        Style Num_restaurant Ratio_restaurant
##       <fctr>          <int>            <dbl>
## 1    chinese            427        0.2883187
## 2   japanese            498        0.3362593
## 3       thai            265        0.1789332
## 4 vietnamese            291        0.1964889
p0 <- ggplot(data, aes(x=Price, fill=Style)) + geom_bar(position='fill') +
  labs(title = 'Percentage of Restaurants for Each Price')
p0
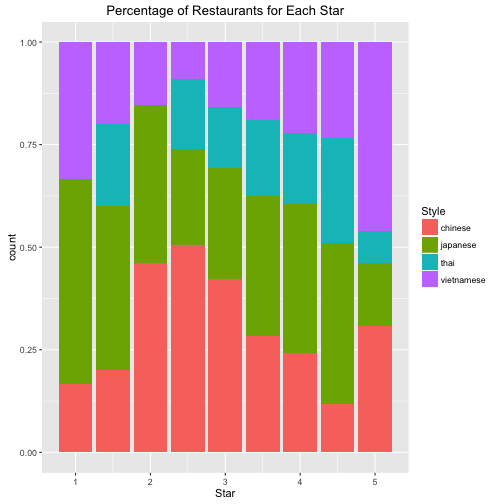
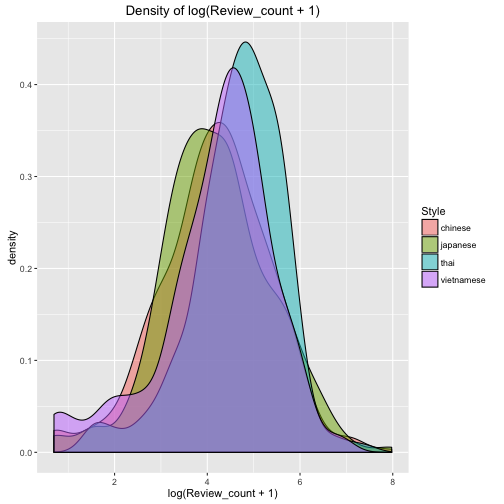
Question 2: Which Asian food are more is more welcome (higher everage rating star and more reviews)?
- It's very astounding that Thai food and Vietnamese has the largest average number of reviews and rating stars.
- Chinese food has the lowest rating star. Although the number of Chinese restaurant is large, but the standard deviation of rating is normal, consistent with the other foods.
- We could infer Chinese food indeed has a lower acceptance in Seattle. I guesss it would be the great gap of food culture between East and West. I will do a future research on review using NLP techniques to reveal why Chinese food has such a lowe score and whether there is biased/underestimated evaluation on Chinese food.
data %>%
  group_by_('Style') %>%
  summarize(avg_num_Review = mean(Review_count), avg_num_Star = mean(Star), std_Star= sd(Star))
## # A tibble: 4 <U+00D7> 4
##        Style avg_num_Review avg_num_Star  std_Star
##       <fctr>          <dbl>        <dbl>     <dbl>
## 1    chinese       124.1967     3.447307 0.5744244
## 2   japanese       132.0301     3.653614 0.5753111
## 3       thai       156.8755     3.675472 0.5403792
## 4 vietnamese       119.3333     3.704467 0.5830484
p1 <- ggplot(data, aes(x=Star, fill=Style)) + geom_bar(position='fill') +
  labs(title = 'Percentage of Restaurants for Each Star')
p2 <- ggplot(data, aes(x=log(Review_count+1), fill=Style)) + geom_density(alpha=0.5) +
  labs(title = 'Density of log(Review_count + 1)')
p1; p2
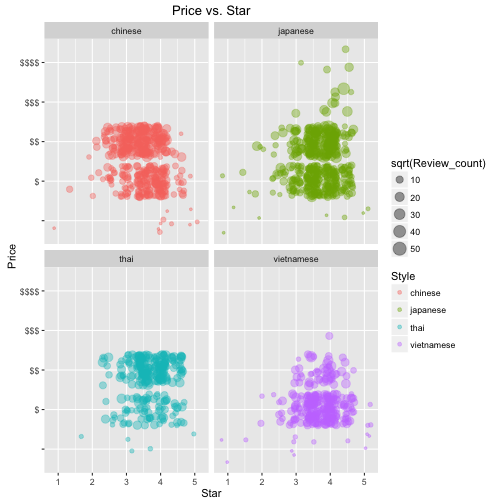
Question 3: The overall visualization and conclusion.
The size of the point indicates the amount of the reviews.(I took the square root so that it's easy to compare). Each color indicates one type of food. From the plot we can see:
- Most restaurant locate in the region of
$-$$and3.5 Star - 4 Star. It looks Thai food and Vietnamese food are more welcome in this region, which is consistent with prior analysis. - Japanese food dominates the hign-end market. Only several high-end resturants with expensive menu and highest rating could impressed customers that Japanese food is excellent.
- Chinese food is cheap and low star rated, also doesn't receive much attention.
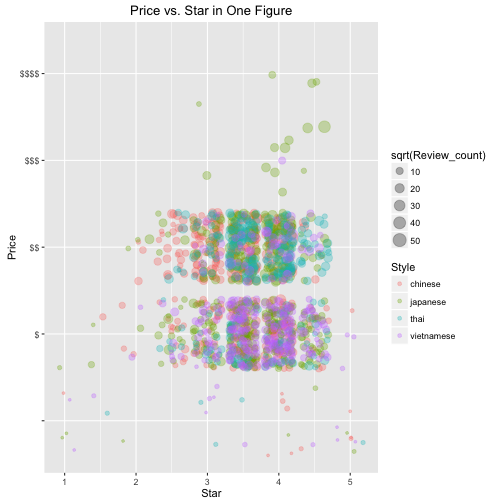
Intuitive Conclusion:
- Japanese food is expensive and highly rated.
- Thai and Vietnamese food is cheap and highly rated.
- Chinese food is cheap and lowly rated.
# Price vs. Star, use Review_count as point size.
set.seed(2016)
p3 <- ggplot(data, aes(x=Star, y=Price, col=Style)) +
  geom_point(position = 'jitter', aes(size=sqrt(Review_count)), alpha=0.4) +
  facet_wrap(~Style, nrow=2) +
  labs(title = 'Price vs. Star')
set.seed(2016)
p4 <- ggplot(data, aes(x=Star, y=Price, col=Style)) +
  geom_point(position = 'jitter', aes(size=sqrt(Review_count)), alpha=0.3) +
  labs(title = 'Price vs. Star in One Figure')
p3; p4
Comments
comments powered by Disqus