
As a international student, after I got the master degree in Statistics, I was looking for a data analyst / data scientist position in US. For international students, one concern is the visa status. It's important to find a employer who sponsors H1B visa. There are some websites like myvisajobs provide the service that you can query the amount of H1B visa application one company filled in the past several year. It's helpful but the user experience is really bad. Another more annoying problem is that you can only query the information by company name.
For job seekers, I believe one key demand is how to find all the companies who sponsor H1B. If we can find out the list of companies who sponsor H1B visa for a specific job position in a specific region, we can increase the job hunting effeciency significantly.
After spending little time in exploring, it's easy to find the data of H1B application of all companies are disclosed on US government website. The data contains the details of each H1B application, including the employer name, job title, state, etc. Go ahead and download the data, we can do any analysis we are interested in.
1. Define the Job Titles
Here use the data science jobs as an example. We come up with all the jobs relative to Data Science (the ones you think may appear within the JOB_TITLE column in the data), for example Statistician, Data Scientist, etc. Also we noticed there are some titles which contain key word Analyst actually are software engineering positions, such as Programmer Analyst, Application Analyst, etc.
We just build two rules to identify the jobs included and excluded.
# read data
library(dplyr)
library(data.table)
setwd(paste0(getwd(), '/Desktop/h1b', sep = ''))
data <- fread('H-1B_Disclosure_Data_FY16.csv', header = T)

# define the data title included and excluded
jobs_include <- c('ANALYST', 'ANALYTICS', 'ANALYSIS', 'STATISTICS',
                  'DATA SCIENTIST', 'STATISTICIAN', 'BIOSTATISTICIAN', 'MODELER',
                  'MACHINE LEARNING', 'DATA SCIENCE', 'PREDICTIVE',
                  'BUSINESS INTELLIGENCE', 'REPORTING')
jobs_exclude <- c('SYSTEM ANALYST', 'SYSTEMS ANALYST', 'IT ANALYST', 'PROGRAMMER ANALYST',
                  'APPLICATION ANALYST', 'COMPUTER ANALYST', 'SOFTWARE')

pattern_include <- paste0(jobs_include, collapse = '|')
pattern_exclude <- paste0(jobs_exclude, collapse = '|')
2. Extract the Data and Generate Files
After we have built the job title rules to filter the rows, it's easy to complete the follow procedures.
# h1b function generated two files: one is the list of employers and the number of h1b; another is the list of the h1b applications filled by each company
h1b <- function(STATE){
  STATE_stats <- data %>%
    select(EMPLOYER_NAME, JOB_TITLE, EMPLOYER_CITY, EMPLOYER_STATE) %>%
    filter(EMPLOYER_STATE == STATE & grepl(pattern = pattern_include, JOB_TITLE) &
             !grepl(pattern = pattern_exclude, JOB_TITLE))

  STATE_stats_unique <- STATE_stats %>%
    group_by(EMPLOYER_NAME) %>%
    summarise(NUM_H1B_STATS = n()) %>%
    arrange(desc(NUM_H1B_STATS))

  STATE_stats_join <- STATE_stats %>%
    inner_join(STATE_stats_unique, by='EMPLOYER_NAME') %>%
    arrange(desc(NUM_H1B_STATS), desc(EMPLOYER_NAME))

  write.csv(STATE_stats_join, file=paste0(STATE, '_stats_h1b.csv'))
  write.csv(STATE_stats_unique, file=paste0(STATE, '_stats_company.csv'))
}

# states can be a vector of the states you want to query, e.g states = c('OH', 'MI', 'IL', 'IN', 'PA')
states = c('OH')
sapply(states, FUN = h1b)
3. Example: Employers Who Sponsor H1B in Ohio
- Sample output of the companies.
library(ggplot2)
ohio_company <- read.csv('OH_stats_company.csv')
ohio_h1b <- read.csv('OH_stats_h1b.csv')
head(ohio_company, 20)
##     X                                 EMPLOYER_NAME NUM_H1B_STATS
## 1   1                            ERP ANALYSTS, INC.            64
## 2   2                            RSR UNLIMITED INC.            62
## 3   3                              SLK AMERICA INC.            53
## 4   4                         CARDINAL HEALTH, INC.            42
## 5   5                          NATIONWIDE INSURANCE            30
## 6   6 FIFTH THIRD BANK, AN OHIO BANKING CORPORATION            22
## 7   7                              LOGIC SOFT, INC.            21
## 8   8                    EVEREST TECHNOLOGIES, INC.            20
## 9   9                               FAST SWITCH LTD            20
## 10 10                          SANTEC RESOURCES INC            20
## 11 11                  THE SHERWIN-WILLIAMS COMPANY            17
## 12 12                    UNITED SOFTWARE GROUP INC.            15
## 13 13               AXCESS FINANCIAL SERVICES, INC.            14
## 14 14                                DATALYSYS, LLC            14
## 15 15               INFORMATION CONTROL COMPANY LLC            14
## 16 16                              CLEVELAND CLINIC            13
## 17 17                               LOGIC SOFT INC.            13
## 18 18                MAST TECHNOLOGY SERVICES, INC.            13
## 19 19 CINCINNATI CHILDREN'S HOSPITAL MEDICAL CENTER            12
## 20 20                   DEDICATED TECHNOLOGIES INC.            12
- Sample output of h1b applications (randomly selected rows):
set.seed(123)
ohio_h1b[floor(runif(6, min=0, max=nrow(ohio_h1b))), 2:6]
##                    EMPLOYER_NAME                        JOB_TITLE
## 326              FAST SWITCH LTD      REQUIREMENTS / TEST ANALYST
## 894          THE OHIO UNIVERSITY  BUSINESS INTELLIGENCE DEVELOPER
## 464             CLEVELAND CLINIC                  BIOSTATISTICIAN
## 1002              THE KROGER CO.    OPERATIONS RESEARCH ANALYST 1
## 1067 INTELLIGRATED SERVICES, LLC SR. IT SOLUTION DELIVERY ANALYST
## 51            ERP ANALYSTS, INC.                       QA ANALYST
##      EMPLOYER_CITY EMPLOYER_STATE NUM_H1B_STATS
## 326         DUBLIN             OH            20
## 894         ATHENS             OH             2
## 464      CLEVELAND             OH            13
## 1002    CINCINNATI             OH             1
## 1067         MASON             OH             1
## 51          DUBLIN             OH            64
- The histogram of companies who sponsor h1b in Ohio.
p <- ggplot(data = ohio_company, aes(x=NUM_H1B_STATS)) +
  geom_histogram(binwidth = 1, fill='orange') +
  labs(title='Data Science H1B Visa Sponsors in Ohio',
       x='Number of H1B', y='Count of Employer') +
  theme_classic()
p
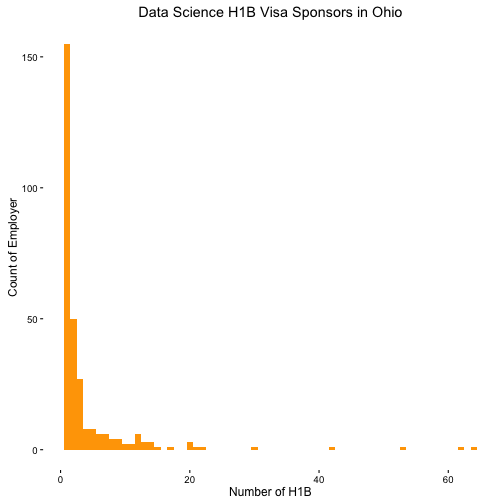
It's amazing that most of the companies only sponsor (hire) just one or two data science employees. It reveals there could be lots of opportunities within these small companies which ignored by most job seekers.
Comments
comments powered by Disqus